DXChrono Desktop
During the last two weeks I have been working on bringing DX Chrono out of the web browser and into a desktop style application, but it needed to be multi-platform and allow me to generate a custom interface (think game more than Microsoft Office)
Technology
DX Chrono Desktop is a Python application built for Windows, macOS, Linux, and Raspberry Pi. The UI and rendering use Pygame (SDL2), with high-DPI support so the map and widgets stay sharp on Retina and high-DPI displays.
The world map is drawn with Pillow (PIL); you can use NASA Blue Marble imagery (downloaded via a small script) or a built-in procedural map. Configuration is YAML-based (config.yaml), and a tabbed in-app settings dialogue (Station, Display, Widgets, Cloudlog, DX Cluster, PSK Reporter, Satellites, Data) avoids editing the file for most options. Solar terminator (grey line) and sun/moon positions come from ephem; satellite orbits and footprints use Skyfield and SGP4 with TLEs from Oscarwatch.
Data is fetched over HTTP (requests) from NOAA for solar indices and band conditions; paho-mqtt is used for the live PSK Reporter feed.
Features
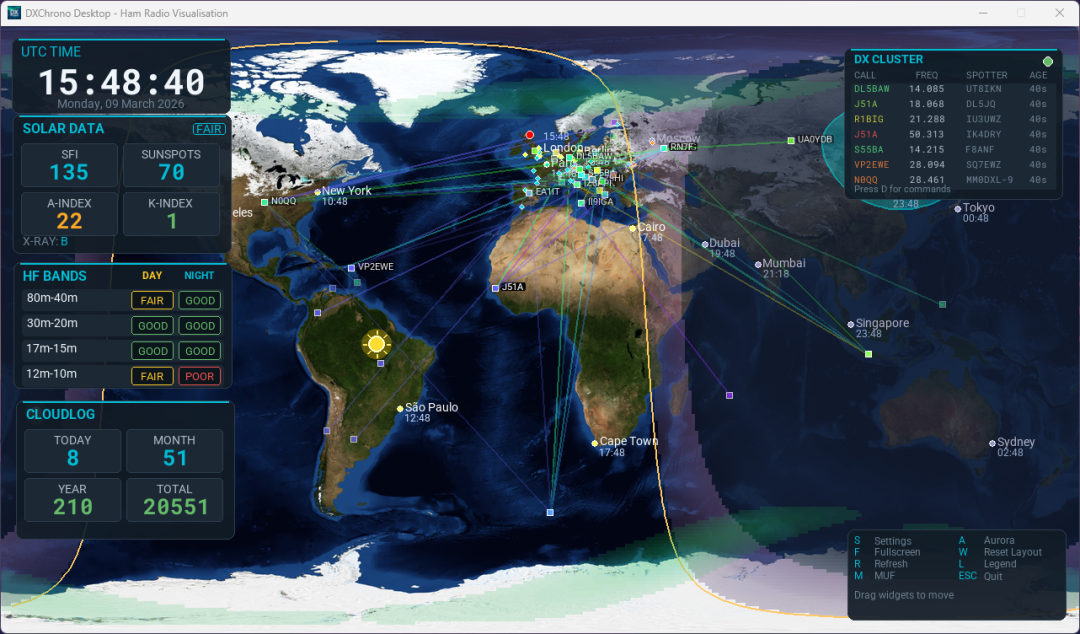
The app centres on a global map with your QTH, grey line, and optional overlays: aurora (NOAA Ovation), MUF (Maximum Usable Frequency), ITU zones, and Maidenhead grid. DX Cluster connects via telnet to DXSpider or AR Clusters; spots appear as markers on the map with optional lines to show the path from the spotter to the DX station, along with a live spots widget, and you can open a command window (e.g. D) to send filters.
You can connect to PSK Reporter using the MQTT feed so you can see “who’s hearing me” and “who I’m receiving” as spots and lines on the map. Cloudlog integration shows QSO statistics (today, month, year, total), recent contacts in a QSO list (date/time, call, band, mode, country, grid), and a “Show QSO Map” view that plots those contacts on the map.
Satellite tracking shows amateur sats (e.g. ISS) and their visibility footprints from TLE data. Draggable widgets include a large UTC clock, solar data (SFI, sunspots, A/K-index, X-ray), HF band conditions (day/night per band), optional station info, Cloudlog panel, DX Cluster list, and MUF-at-QTH. Cities on the map can show local time. Fullscreen and windowed modes are supported, and the whole thing is suitable for a dedicated shack or kiosk display.
Wrapping up
Fair to say it's pretty feature complete, I have plans for N1MM+ UDP integration for showing QSOs as markers and also a special event station function, but more to come on that later.
The release date will be in the coming weeks. If you want to stay in the loop, you can join the DX Chrono newsletter https://hive.int.magicbug.co.uk/lists/join/dxchrono and be one of the first to download it.